MM Day Trader LevelsAs an intraday trader, there are certain key levels that I care about for short-term price action on every single chart. When I first began day trading, each morning I would painstakingly mark those key levels off on the charts I planned to trade each day. Depending on the number of charts I was watching, this would take up quite a bit of my time that I felt would have been much better spent doing other things. It also meant that those levels would often be left behind, and on later days I might be trading a symbol and get confused when a line appeared and I'd be paying attention to it only to later discover that it wasn't from prior day, but from some other day in the past when I had marked it off.
I looked all over TradingView to find indicators that did this automatically for me, and I found a lot of them. One by one I tried them, and inevitably I would always find that something was wrong with them. Often they didn't have all of the levels I wanted (so I would have to combine multiple indicators), but more often I found that the levels would be incorrect, or they would be buggy and not appear consistently, or they would not appear at the right time, or they would not work on futures! The list of problems went on and on. And the biggest issue I found was that nobody knew how to get session volume profile in an indicator.
So, over the course of a few years I figured out how to solve all of those problems and now I'm thrilled to present this free indicator for everyone like me who trades intraday and wants a clean consistent way to see the prior day levels that they care about automatically on every single chart (even futures). The levels the indicator provides are:
Yesterday High & Low
Value Area High & Low & Point of Control
Today's Open
Yesterday's Close (aka "Settlement" on futures)
Premarket High & Low (non-futures only)
Overnight High & Low (futures only)
These levels are extremely important, and I expect price to be reactive to them, so each level has a shaded background behind it so that the levels stand out against other lines you may have on your chart. I try to keep configuration as simple as possible, but there are configuration options that allow you to:
Hide any of the levels
Change the color for the levels
Shade the value area (or not)
Change the label text, size, type (basic label or plain text) and location (how far to the right of last candle to place the label
Adjust session volume profile value area volume & number of rows
The biggest advantage to this indicator over others on TradingView is how it handles session volume profile. When it comes to futures, TradingView does differentiate between regular trading hours and "electronic" trading hours on the charts, but their timeframes for those sessions are unusual, and they do not provide any programmatic way to differentiate between them. So, I created a whole new library for dealing with futures sessions that is fully integrated into both my Session Volume Profile library and this indicator, allowing me to bring you the best and only custom indicator available on TradingView that provides you with true regular session volume profile information across every type of symbol, including futures.
I'm incredibly proud of everything I've been able to provide with this indicator, and even more thrilled to say that I'm proud of how the indicator has been implemented. Once again releasing this indicator and all associated code for free and open source. I encourage you to take a look at the source code to see how it all works, take advantage of the free underlying libraries I created to make all of this possible: Session Library and Session Volume Profile Library.
Tìm kiếm tập lệnh với "point of control"

Fixed Range FootprintFixed Range Footprint allows you to analyze the Footprint over a specified time period. By enabling the "Extend Right" option, the Footprint transforms into a classic mode, extending from the starting point to the most recent bar in real-time.
Input Options:
Group: Coordinates
"Start range": Defines the starting coordinate for the Footprint period.
"End range": Defines the ending coordinate for the Footprint period.
Group: Row Size
"Ticks Per Row": Directly sets the price step, calculated by multiplying the input value by syminfo.mintick.
"Auto": Activates automatic mode for selecting the "Ticks Per Row" value.
"Max row": Relevant in auto mode; it limits the number of rows within a bar. The automatic calculation for "Ticks Per Row" is based on the first available bar and applied to subsequent bars.
Group: Imbalance
"Imbalance Percent": Sets a percentage-based coefficient to determine price level Imbalance by comparing the diagonal buy price to the previous sell price.
"Stacked levels": Defines the minimum number of consecutive Imbalance levels required to draw extended lines.
Group: Support
"Show Footprint Info": Toggles the display of Footprint information.
Group: Value Area
"Value Area": Sets the percentage for the Value Area.
"POC": Toggles the Point of Control (POC).
"VAH": Toggles the Value Area High (VAH).
"VAL": Toggles the Value Area Low (VAL).
"Show Volume Profile": Displays buy/sell volume at each level.
Group: Alerts
"Alert on New Imbalance": Enables alerts for the creation of new Imbalance levels.
"Alert on New Imbalance Line": Enables alerts for the creation of new Imbalance lines.
"Alert on Stop Past Imbalance Line": Enables alerts when price stops past an Imbalance line.
Fixed volume profile & zonesHi all!
If you like volume profile and like to create zones, where the price might react, this indicator might be for you. It plots a fixed volume profile and creates a user defined number of zones (shelves) of high volume.
If you want to know more about volume profile you can about it here on TradingView: se.tradingview.com
To do
• Add possiblity to create alerts for zone entries, breakouts and retest
• The importance of zones are now based on high volume slots only. It might be changed to include the slots around the 'master slot' to determine if the area is of high importance or not, your suggestions here are welcome!
• Show total volume in 'values'
• Error if the data cannot be fetched
• Add value area
• Make earlier (more important shelves) more visible (less transparent)
• Add possiblity to skip zones
Known issues
• Script execution is long when the volume profile is created (should be none)
• In some cases you can get overlapping shelves, avoid this
Settings
• Main
• Start/end bar of the volume profile (this is required)
• Data
• Timeframe (for getting the volume data)
• Levels (the number of slots in the volume profile)
• Shelves (the number of zones with high volume to plot) and it's color
• Max slot (have this enabled if you want the shelf's highest volume slot to have a dotted line and choose it's color
• Show info (show the order of the plotted zone)
• Style (how the volume profile will look)
• Histogram box (the color of the background of the volume profile)
• Up (the color of bullish volume)
• Down (the color of bearish volume)
• Point of control (color and if it should be extended or not)
• Values and text color (show bullish and bearish volume values)
The defaults on all settings are based on the daily timeframe. This indicator is not 'complete' and I plan to work on it when I get the time.
Note that the precision for the volume profile is per candle, so some levels can have visuals as others but lower volume.
The slot (level) volume has to have a lower difference to the volume included in the shelf than the next volume to be checked to be included. If the level being checked for inclusion in a shelf is at the end of boundaries (high and low) of the volume profile, the volume has to be higher than the golden ratio of the volume before.
You can also use this indicator if you just want a volume profile to show, just set the the number of zones to plot (in 'Shelves') to 0.
I hope I haven't forgotten anything and that it's clear, let me know otherwise.
Best of trading luck!

POC IndicatorThis simplified Point of Control (POC) indicator for TradingView is designed to identify and plot the price level where the highest volume of trading occurred over a specified period. The script works as follows:
Input and Initialization: The user specifies a length for the analysis period. Variables highestVolPrice and highestVol are initialized to track the price with the highest volume and the highest volume encountered, respectively.
Volume Analysis Loop: For each bar in the specified period (up to length bars back from the current bar), the script compares the volume of the current bar (volume ) to highestVol. If the current bar's volume is higher, highestVol and highestVolPrice are updated to reflect the volume and closing price of the current bar.
Plotting the POC: Instead of using a horizontal line (hline), which cannot be dynamically updated within the loop, the script uses plot to draw the POC. This plotting function draws a line on the chart that represents the closing price level associated with the highest volume observed within the analysis period.
Resetting Variables: To ensure the indicator updates correctly with each new bar, the script resets highestVol and highestVolPrice at the start of the analysis for each new period. This step is designed to recalculate the POC dynamically as new data comes in.
This approach offers a basic method for visualizing significant price levels where substantial trading activity occurred, potentially indicating areas of strong support or resistance. However, it's a simplified model and does not calculate the true POC based on a detailed volume profile across all price levels within the period.
SessionVolumeProfileLibrary "SessionVolumeProfile"
Analyzes price & volume during regular trading hours to provide a session volume profile analysis. The primary goal of this library is to provide the developer with three values: the value area high, low and the point of control. The library also provides methods for rendering the value areas and histograms. To learn more about this library and how you can use it, click on the website link in my profile where you will find a blog post with detailed information.
debug(vp, position)
Helper function to write some information about the supplied SVP object to the screen in a table.
Parameters:
vp (Object) : The SVP object to debug
position (string) : The position.* to place the table. Defaults to position.bottom_center
getLowerTimeframe()
Depending on the timeframe of the chart, determines a lower timeframe to grab volume data from for the analysis
Returns: The timeframe string to fetch volume for
get(volumeProfile, lowerTimeframeHigh, lowerTimeframeLow, lowerTimeframeVolume)
Populated the provided SessionVolumeProfile object with vp data on the session.
Parameters:
volumeProfile (Object) : The SessionVolumeProfile object to populate
lowerTimeframeHigh (float ) : The lower timeframe high values
lowerTimeframeLow (float ) : The lower timeframe low values
lowerTimeframeVolume (float ) : The lower timeframe volume values
drawPriorValueAreas(todaySessionVolumeProfile, extendYesterdayOverToday, showLabels, labelSize, pocColor, pocStyle, pocWidth, vahlColor, vahlStyle, vahlWidth, vaColor)
Given a SessionVolumeProfile Object, will render the historical value areas for that object.
Parameters:
todaySessionVolumeProfile (Object) : The SessionVolumeProfile Object to draw
extendYesterdayOverToday (bool) : Defaults to true
showLabels (bool) : Defaults to true
labelSize (string) : Defaults to size.small
pocColor (color) : Defaults to #e500a4
pocStyle (string) : Defaults to line.style_solid
pocWidth (int) : Defaults to 1
vahlColor (color) : The color of the value area high/low lines. Defaults to #1592e6
vahlStyle (string) : The style of the value area high/low lines. Defaults to line.style_solid
vahlWidth (int) : The width of the value area high/low lines. Defaults to 1
vaColor (color) : The color of the value area background. Defaults to #00bbf911)
drawHistogram(volumeProfile, bgColor, showVolumeOnHistogram)
Given a SessionVolumeProfile object, will render the histogram for that object.
Parameters:
volumeProfile (Object) : The SessionVolumeProfile object to draw
bgColor (color) : The baseline color to use for the histogram. Defaults to #00bbf9
showVolumeOnHistogram (bool) : Show the volume amount on the histogram bars. Defaults to false.
Object
Fields:
numberOfRows (series__integer)
valueAreaCoverage (series__integer)
trackDevelopingVa (series__bool)
valueAreaHigh (series__float)
pointOfControl (series__float)
valueAreaLow (series__float)
startTime (series__integer)
endTime (series__integer)
dayHigh (series__float)
dayLow (series__float)
step (series__float)
pointOfControlLevel (series__integer)
valueAreaHighLevel (series__integer)
valueAreaLowLevel (series__integer)
volumeRows (array__float)
priceLevelRows (array__float)
ltfSessionHighs (array__float)
ltfSessionLows (array__float)
ltfSessionVols (array__float)
Volume Profile - BearJust another Volume Profile but you can fit into your chart better by moving back and forth horizontally. also note you can fix the number of bars to show the volume by that way you can use a fib retracment to line up high/low volume nodes with fib levels... see where price as bad structure. or just play with the colors to make a cool gradient?
Volume Profile is a technical analysis tool used by traders to analyze the distribution of trading volume at different price levels within a specified time frame. It helps traders identify key support and resistance levels, potential areas of price reversals, and areas of high trading interest. Here's how to read Volume Profile on a trading chart:
1. **Choose a Time Frame**: Decide on the time frame you want to analyze. Volume Profile can be applied to various time frames, such as daily, hourly, or even minute charts. The choice depends on your trading style and goals.
2. **Plot the Volume Profile**: Once you have your chart open, add the Volume Profile indicator. Most trading platforms offer this tool. It typically appears as a histogram or a series of horizontal bars alongside the price chart.
3. **Identify Key Elements**:
a. **Value Area**: The Value Area represents the price range where the majority of trading volume occurred. It is often divided into three parts: the Point of Control (POC) and the upper and lower value areas. The POC is the price level where the most trading activity occurred and is considered a significant support or resistance level.
b. **High-Volume Nodes**: High-volume nodes are price levels where there was a significant amount of trading volume. These nodes can act as support or resistance levels because they represent areas where many traders had their positions.
c. **Low-Volume Areas**: Conversely, low-volume areas are price levels with little trading activity. These areas may not provide strong support or resistance because they lack significant trader interest.
4. **Interpretation**:
- If the price is trading above the POC and the upper value area, it suggests bullish sentiment, and these levels may act as support.
- If the price is trading below the POC and the lower value area, it suggests bearish sentiment, and these levels may act as resistance.
- High-volume nodes can also act as support or resistance, depending on the price's current position relative to them.
5. **Confirmation**: Volume Profile should be used in conjunction with other technical analysis tools and indicators to confirm trading decisions. Consider using trendlines, moving averages, or other price patterns to validate your trading strategy.
6. **Adjust for Different Time Frames**: Keep in mind that Volume Profile analysis can yield different results on different time frames. For example, a support level on a daily chart may not hold on a shorter time frame due to intraday volatility.
7. **Practice and Experience**: Like any trading tool, reading Volume Profile requires practice and experience. Analyze historical charts, paper trade, and refine your strategies over time to gain proficiency.
8. **Stay Informed**: Stay updated with market news and events that can impact trading volume. Sudden news can change the significance of volume levels.

Oscillator Profile IndicatorDescription:
The Oscillator Profile Indicator (OPI) is designed to provide insights into market trends and potential reversal points by profiling the value distribution of an oscillator or the price chart over a specified lookback period.
The OPI works by calculating the Point of Control (PoC) for the oscillator values or prices in the given lookback period. This PoC, essentially a median, is considered the fair value where most trading activities have happened. Along with this, OPI also calculates lower and upper boundaries by taking the specified percentile of the sorted distribution of values. These boundaries outline the value area within which a significant portion of trading activity has occurred.
The main feature of the OPI is the interpretation of PoC movement and how it relates to general market trends. If the PoC moves above 0 on the oscillator, it's a potential indication that we are in a general uptrend. Conversely, if the PoC moves below 0, this can be a signal for a general downtrend.
Usage:
While OPI can be used on both price charts and oscillators, its effectiveness is more pronounced when used on oscillators. Applying this indicator to oscillators such as the Relative Strength Index (RSI) or the Moving Average Convergence Divergence (MACD) can provide useful insights.
How to Read:
PoC line: The line represents the median of the past 'n' periods. Its movement above or below 0 can be used to identify general uptrends or downtrends respectively.
Upper and Lower Boundary lines: These lines represent the specified percentile of the value distribution in the lookback period.
Colored Fills: The fills between the upper and lower boundary lines visually represent the value area. The color changes based on the relative position of the source value (price or oscillator value) to the PoC.
Signals:
An uptrend is indicated when the PoC moves above 0 on the oscillator, especially when coupled with an upward crossover of the source value through the PoC.
A downtrend is signaled when the PoC drops below 0 on the oscillator, particularly when paired with a downward crossover of the source value through the PoC.
(!) Note: Like all indicators, OPI should be used in conjunction with other technical analysis tools for the best results. It is also advisable to backtest this indicator with your strategy before using it in live trading.

Volume Profile Matrix [LuxAlgo]The Volume Profile Matrix indicator extends from regular volume profiles by also considering calculation intervals within the calculation window rather than only dividing the calculation window in rows.
Note that this indicator is subject to repainting & back-painting, however, treating the indicator as a tool for identifying frequent points of interest can still be very useful.
🔶 SETTINGS
Lookback: Number of most recent bars used to calculate the indicator.
Columns: Number of columns (intervals) used to calculate the volume profile matrix.
Rows: Number of rows (intervals) used to calculate the volume profile matrix.
🔶 USAGE
The Volume Profile Matrix indicator can be used to obtain more information regarding liquidity on specific time intervals. Instead of simply dividing the calculation window into equidistant rows, the calculation is done through a grid.
Grid cells with trading activity occurring inside them are colored. More activity is highlighted through a gradient and by default, cells with a color that are closer to red indicate that more trading activity took place within that cell. The cell with the highest amount of trading activity is always highlighted in yellow.
Each interval (column) includes a point of control which highlights an estimate of the price level with the highest traded volume on that interval. The level with the highest traded volume of the overall grid is extended to the most recent bar.

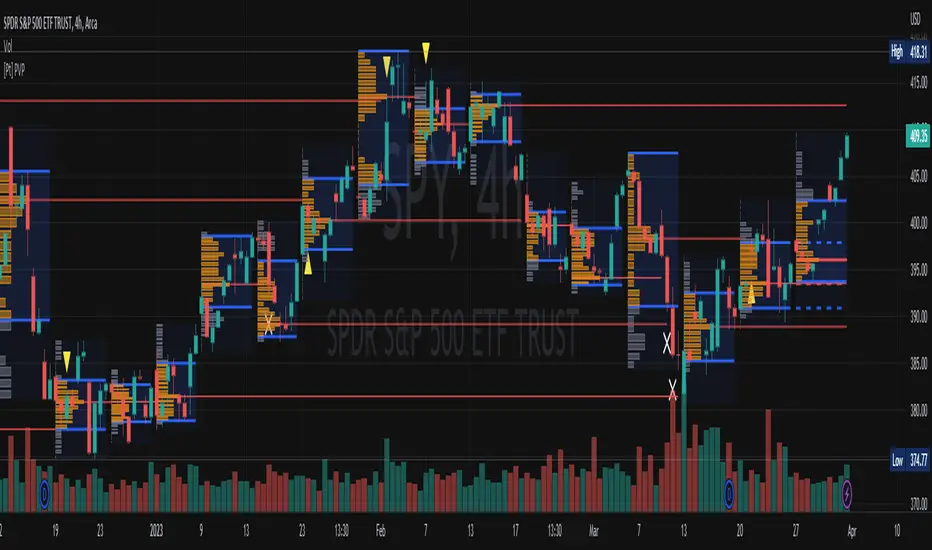
Volume Profile Fixed Range Support and Resistance LevelsThis script is based on the excellent Volume Profile / Fixed Range indicator by @LonesomeTheBlue, so all credit for the foundations of this indicator goes to @LonesomeTheBlue
I basically made 5 instances of the original script and added horizontal lines at the beginning and end of the each Value Area. To use the script as a support and resistance tool without the Value Areas and Point of Control (POC) labels you just need to untick "Boxes" and "Labels" in the "Style" section of the “Settings”.
The default look-back periods (in bars) are 7, 30, 60, 180 and 365, but you can change this or the colour of the lines easily in the “Settings”.
The dashed lines are the respective POC.
I find this tool to be very useful for quickly identifying interest levels on any chart while also ensuring a certain amount of objectivity in your TA.
Hope you find it useful and thanks again to @LonesomeTheBlue for going through the trouble of coding this and being so generous to share it with the rest of us!
Good luck out there!

[Pt] Periodic Volume ProfileThis script is an attempt to recreate the Periodic Volume Profile that is built-in by TradingView, with slightly different features. Related blog: www.tradingview.com
This script is based on another script "Volume Profile, Pivot Anchored" by @dgtrd
*Note that only limited number Volume Profile can be displayed on the chart due to limitations on displaying boxes and lines.
Description
This Periodic Volume Profile (PVP) indicator allows trades to view volume profiles for periods longer than the current timeframe. The indicator builds one general volume profile for each new period, set by the user through the “Periodic Timeframe” input parameter.
This script also has the option to extend Point of Control (POC) lines with optional end conditions: Until Bar Touch, Until Last Bar, Until Bar Cross, or None, which extends to the right.
Signals are generated for Naked POC touches and crosses by a triangle symbol and a cross symbol, by default.
Alerts are available for POC touches and crosses.
What is Volume Profile?
Volume profile is a technical analysis tool that shows the volume of trades at different prices for a given security or market over a specific period of time.
Volume profile can be used to identify key levels of support and resistance, as well as to assess the overall supply and demand for a security. For example, if there is a high volume of trades at a particular price level, this may indicate that there is a significant level of support or resistance at that price. On the other hand, if there is relatively low volume at a particular price, this may indicate that there is not much interest in trading at that level.
Traders can use volume profile to identify trends, make trading decisions, and set stop-loss and take-profit orders. It can also be useful for identifying patterns such as "pockets of liquidity," which are areas where there is a high volume of trades but relatively little price movement.
It is important to note that volume profile should be used in conjunction with other technical analysis tools and should not be relied upon in isolation. It is also important to consider the overall context and market conditions when interpreting volume profile data.
Key Difference with TradingView's PVP indicator - TradingView's PVP intraday period does not align with standard intraday timeframes as it is determined by # of bars. This script provides volume profiles that aligns with higher timeframe periods.
Enjoy~!
Magnifying Glass (LTF Candles) by SiddWolf█ OVERVIEW
This indicator displays The Lower TimeFrame Candles in current chart, Like Zooming in on the Candle to see it's Lower TimeFrame Structure. It plots intrabar OHLC data inside a Label along with the volume structure of LTF candle in an eloquent format.
█ QUICK GUIDE
Just apply it to the chart, Hover the mouse on the Label and ta-da you have a Lower Timeframe OHLC candles on your screen. Move the indicator to the top and shrink it all the way up, because all the useful data is inside the label.
Inside the label: The OHLC ltf candles are pretty straightforward. Volume strength of ltf candles is shown at bottom and Volume Profile on the left. Read the Details below for more information.
In the settings, you will find the option to change the UI and can play around with Lower TimeFrame Settings.
█ DETAILS
First of all, I would like to thank the @TradingView team for providing the function to get access to the lower timeframe data. It is because of them that this magical indicator came into existence.
Magnifying Glass indicator displays a Candle's Lower TimeFrame data in Higher timeframe chart. It displays the LTF candles inside a label. It also shows the Volume structure of the lower timeframe candles. Range percentage shown at the bottom is the percentage change between high and low of the current timeframe candle. LTF candle's timeframe is also shown at the bottom on the label.
This indicator is gonna be most useful to the price action traders, which is like every profitable trader.
How this indicator works:
I didn't find any better way to display ltf candles other than labels. Labels are not build for such a complex behaviour, it's a workaround to display this important information.
It gets the lower timeframe information of the candle and uses emojis to display information. The area that is shown, is the range of the current timeframe candle. Range is a difference between high and low of the candle. Range percentage is also shown at the bottom in the label.
I've divided the range area into 20 parts because there are limitation to display data in the labels. Then the code checks out, in what area does the ltf candle body or wick lies, then displays the information using emojis.
The code uses matrix elements for each block and relies heavily on string manipulation. But what I've found most difficult, is managing to fit everything correctly and beautifully so that the view doesn't break.
Volume Structure:
Strength of the Lower TimeFrame Candles is shown at the bottom inside the label. The Higher Volume is shown with the dark shade color and Lower Volume is shown with the light shade. The volume of candles are also ranked, with 1 being the highest volume, so you can see which candle have the maximum to minimum volume. This is pretty important to make a price action analysis of the lower timeframe candles.
Inside the label on the left side you will see the volume profile. As the volume on the bottom shows the strength of each ltf candles, Volume profile on the left shows strength in a particular zone. The Darker the color, the higher the volume in the zone. The Highest volume on the left represents Point of Control (Volume Profile POC) of the candle.
Lower TimeFrame Settings:
There is a limitation for the lowest timeframe you can show for a chart, because there is only so much data you can fit inside a label. A label can show upto 20 blocks of emojis (candle blocks) per row. Magnifying Glass utilizes this behaviour of labels. 16 blocks are used to display ltf candles, 1 for volume profile and two for Open and Close Highlighter.
So for any chart timeframe, ltf candles can be 16th part of htf candle. So 4 hours chart can show as low as 15 minutes of ltf data. I didn't provide the open settings for changing the lower timeframe, as it would give errors in a lot of ways. You can change the timeframe for each chart time from the settings provided.
Limitations:
Like I mentioned earlier, this indicator is a workaround to display ltf candles inside a label. This indicator does not work well on smaller screens. So if you are not able to see the label, zoom out on your browser a bit. Move the indicator to either top or bottom of all indicators and shrink it's space because all details are inside the label.
█ How I use MAGNIFYING GLASS:
This indicator provides you an edge, on top of your existing trading strategy. How you use Magnifying Glass is entirely dependent on your strategy.
I use this indicator to get a broad picture, before getting into a trade. For example I see a Doji or Engulfing or any other famous candlestick pattern on important levels, I hover the mouse on Magnifying Glass, to look for the price action the ltf candles have been through, to make that pattern. I also use it with my "Wick Pressure" indicator, to check price action at wick zones. Whenever I see price touching important supply and demand zones, I check last few candles to read chart like a beautiful price action story.
Also volume is pretty important too. This is what makes Magnifying Glass even better than actual lower timeframe candles. The increasing volume along with up/down trend price shows upward/downward momentum. The sudden burst (peak) in the volume suggests volume climax.
Volume profile on the left can be interpreted as the strength/weakness zones inside a candle. The low volume in a price zone suggests weakness and High volume suggests strength. The Highest volume on the left act as POC for that candle.
Before making any trade, I read the structure of last three or four candles to get the complete price action picture.
█ Conclusion
Magnifying Glass is a well crafted indicator that can be used to track lower timeframe price action. This indicator gives you an edge with the Multi Timeframe Analysis, which I believe is the most important aspect of profitable trading.
~ @SiddWolf

Naked Intrabar POCThis indicator with an unfortunate and very non PC sounding name approximates (!) the intrabar point of control (POC) either from time or volume at price.
Due to pine limitations, bin size and the sample lower time frame selection will have at least some effect on the accuracy of the approximation. The trade off is between accuracy and historical availability, however bar replay can be used to view prior historical states beyond what is visible from the current real time bar.
In order for all intrabar POC circles to be visible, you will need to manually set the visual order of the indicator by bringing it to the front.
Since the POC represents a price point around which the highest market participation occurred, the exposed global variable intrabar_poc may (or may not) be interesting as an alternative to ohlc based source input.

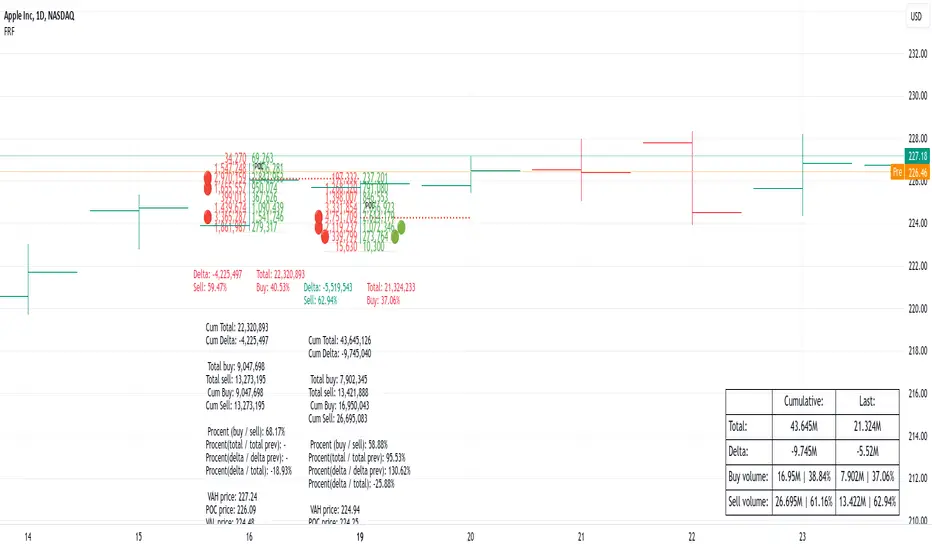
Realtime FootprintThe purpose of this script is to gain a better understanding of the order flow by the footprint. To that end, i have added unusual features in addition to the standard features.
I use "Real Time 5D Profile by LucF" main engine to create basic footprint(profile type) and added some popular features and my favorites.
This script can only be used in realtime, because tradingview doesn't provide historical Bid/Ask date.
Bid/Ask date used this script are up/down ticks.
This script can only be used by time based chart (1m, 5m , 60m and daily etc)
This script use many labels and these are limited max 500, so you can't display many bars.
If you want to display foot print bars longer, turn off the unused sub-display function.
Default setting is footprint is 25 labels, IB count is 1, COT high and Ratio high is 1, COT low and Ratio low is 1 and Delta Box Ratio Volume is 1 , total 29.
plus UA , IB stripes , ladder fading mark use several labels.
///////// General Setting ///////////
Resets on Volume / Range bar
: If you want to use simple time based Resets on, please set Total Volume is 0.
Your timeframe is always the first condition. So if you set Total Volume is 1000, both conditions(Volume >= 1000 and your timeframe start next bar) must be met. (that is, new footprint bar doesn't start at when total volume = exactly 1000).
Ticks per row and Maximum row of Bar
: 1 is minimum size(tick). "Maximum row of Bar" decide the number of rows used in one footprint. 1 row is created from 1 label, so you need to reduce this number to display many footprints (Max label is 500).
Volume Filter and For Calculation and Display
: "Volume Filter" decide minimum size of using volume for this script.
"For Calculation and Display" is used to convert volume to an integer.
This script only use integer to make profile look better (I contained Bid number and Ask number in one row( one label) to saving labels. This require to make no difference in width by the number of digits and this script corresponds integers from 0 to 3 digits).
ex) Symbol average volume size is from 0.0001 to 0.001. You decide only use Volume >= 0.0005 by "Volume Filter".
Next, you convert volume to integer, by setting "For Calculation and Display" is 1000 (0.0005 * 1000 = 5).
If 0.00052 → 5.2 → 5, 0.00058 → 5.8 → 6 (Decimal numbers are rounded off)
This integer is used to all calculation in this script.
//////// Main Display ///////
Footprint, Total, Row Delta, Diagonal Delta and Profile
: "Footprint" display Ask and Bid per row. "Total" display Ask + Bid per row.
"Row Delta" display Ask - Bid per row. "Diagonal Delta" display Ask(row N) - Bid(row N -1) per row.
Profile display Total Volume(Ask + Bid) per row by using Block. Profile Block coloring are decided by Row Delta value(default: positive Row Delta (Ask > Bid) is greenish colors and negative Row Delta (Ask < Bid) is reddish colors.)
Volume per Profile Block, Row Imbalance Ratio and Delta Bull/Bear/Neutral Colors
: "Volume per Profile Block" decide one block contain how many total volume.
ex) When you set 20, Total volume 70 display 3 block.
The maximum number of blocks that can be used per low is 20.
So if you set 20, Total volume 400 is 20 blocks. total volume 800 is 20 blocks too.
"Row Imbalance Ratio" decide block coloring. The row imbalance is that the difference between Ask and Bid (row delta) is large.
default is x3, x2 and x1. The larger the difference, the brighter the color.
ex) Ask 30 Bid 10 is light green. Ask 20 Bid 10 is green. Ask 11 Bid 10 is dark green.
Ask 0 Bid 1 is light red. Ask 1 Bid 2 is red. ask 30 Bid 59 is dark green.
Ask 10 Bid 10 is neutral color(gray)
profile coloring is reflected same row's other elements(Ask, Bid, Total and Delta) too.
It's because one label can only use one text color.
/////// Sub Display ///////
Delta, total and Commitment of Traders
: "Delta" is total Ask - total Bid in one footprint bar. Total is total Ask + total Bid in one footprint bar.
"Commitment of traders" is variation of "Delta". COT High is reset to 0 when current highest is touched. COT Low is opposite.
Basic concept of Delta is to compare price with Delta. Ordinary, when price move up, delta is positive. Price move down is negative delta.
This is because market orders move price and market orders are counted by Delta (although this description is not exactly correct).
But, sometimes prices do not move even though many market orders are putting pressure on price , or conversely, price move strongly without many market orders.
This is key point. Big player absorb market orders by iceberg order(Subdivide large orders and pretend to be small limit orders.
Small limit orders look weak in the order book, but they are added each time you fill, so they are more powerful than they look.), so price don't move.
On the other hand, when the price is moving easily, smart players may be aiming to attract and counterattack to a better price for them.
It's more of a sport than science, and there's always no right response. Pay attention to the relationship between price, volume and delta.
ex) If COT Low is large negative value, it means many sell market orders is coming, but iceberg order is absorbing their attack at limit order.
you should not do buy entry, only this clue. but this is one of the hints.
"Delta, Box Ratio and Total texts is contained same label and its color are "Delta" coloring. Positive Delta is Delta Bull color(green),Negative Delta is Delta Bear Color
and Delta = 0 is Neutral Color(gray). When Delta direction and price direction are opposite is Delta Divergence Color(yellow).
I didn't add the cumulative volume delta because I prefer to display the CVD line on the price chart rather than the number.
Box Ratio , Box Ratio Divisor and Heavy Box Ratio Ratio
: This is not ordinary footprint features, but I like this concept so I added.
Box Ratio by Richard W. Arms is simple but useful tool. calculation is "total volume (one bar) divided by Bar range (highest - lowest)."
When Bull and bear are fighting fiercely this number become large, and then important price move happen.
I made average BR from something like 5 SMA and if current BR exceeds average BR x (Heavy Box Ratio Ratio), BR box mark will be filled.
Box Ratio Divisor is used to good looking display(BR multiplied by Box Ratio Divisor is rounded off and displayed as an integer)
Diagonal Imbalance Count , D IB Mark and D IB Stripes
: Diagonal Imbalance is defined by "Diagonal Imbalance Ratio".
ex) You set 2. When Ask(row N) 30 Bid(row N -1)10, it's 30 > 10*2, so positive Diagonal Imbalance.
When Ask(row N) 4 Bid(row N -1)9, it's 4*2 < 9, so negative Diagonal Imbalance.
This calculation does not use equals to avoid Ask(row N) 0 Bid(row N -1)0 became Diagonal Imbalance.
Ask(row N) 0 Bid(row N -1)0, it's 0 = 0*2, not Diagonal Imbalance. Ask(row N) 10 Bid(row N -1)5, it's 10 = 5*2, not Diagonal Imbalance.
"D IB Mark" emphasize Ask or Bid number which is dominant side(Winner of Diagonal Imbalance calculation), by under line.
"Diagonal Imbalance Count" compare Ask side D IB Mark to Bid side D IB Mark in one footprint.
Coloring depend on which is more aggressive side (it has many IB Mark) and When Aggressive direction and price direction are opposite is Delta Divergence Color(yellow).
"D IB Stripes" is a function that further emphasizes with an arrow Mark, when a DIB mark is added on the same side for three consecutive row. Three consecutive arrow is added at third row.
Unfinished Auction, Ratio Bounds and Ladder fading Mark
: "Unfinished Auction" emphasize highest or lowest row which has both Ask and Bid, by Delta Divergence Color(yellow) XXXXXX mark.
Unfinished Auction sometimes has magnet effect, price may touch and breakout at UA side in the future.
This concept is famous as profit taking target than entry decision.
But, I'm interested in the case that Big player make fake breakout at UA side and trapped retail traders, and then do reversal with retail traders stop-loss hunt.
Anyway, it's not stand alone signal.
"Ratio Bounds" gauge decrease of pressure at extreme price. Ratio Bounds High is number which second highest ask is divided by highest ask.
Ratio Bounds Low is number which second lowest bid is divided by lowest bid. The larger the number, the less momentum the price has.
ex)first footprint bar has Ratio Bounds Low 2, second footprint bar has RBL 4, third footprint bar has RBL 20.
This indicates that the bear's power is gradually diminishing.
"Ladder fading mark" emphasizes the decrease of the value in 3 consecutive row at extreme price. I added two type Marks.
Ask/Bid type(triangle Mark) is Ask/Bid values are decreasing of three consecutive row at extreme price.
Row Imbalance type(Diamond Mark) are row Imbalance values are decreasing of three consecutive row at extreme price.
ex)Third lowest Bid 40, second lowest Bid 10 and lowest Bid 5 have triangle up Mark. That is bear's power is gradually diminishing.
(This Mark only check Bid value at lowest price and Ask value at highest price).
Third highest row delta + 60, second highest row delta + 5, highest delta - 20 have diamond Mark. That is Bull's power is gradually diminishing.
Sub display use Delta colors at bottom of Sub display section.
////// Candle & POC /////////
candle and POC
: Ordinary, "POC" Point of Control is row of largest total volume, but this script'POC is volume weighted average.
This is because the regular POC was visually displayed by the profile ,and I was influenced LucF's ideas.
POC coloring is decided in relation to the previous POC. When current POC is higher than previous POC, color is UP Bar Color(green).
In the opposite case, Down Bar color is used.
POC Divergence Color is used when Current POC is up but current bar close is lower than open (Down price Bar),or in the opposite case.
POC coloring has option also highlight background by Delta Divergence Color(yellow). but bg color is displayed at your time frame current price bar not current footprint bar.
The basic explanation is over.
I add some image to promote understanding basic ideas.

Synthetic Price Action GeneratorNOTICE:
First thing you need to know, it "DOES NOT" reflect the price of the ticker you will load it on. THIS IS NOT AN INDICATOR FOR TRADING! It's a developer tool solely generating random values that look exactly like the fractals we observe every single day. This script's generated candles are as fake as the never ending garbage news cycles we are often force fed and expected to believe by using carefully scripted narratives peddled as hypnotic truth to psychologically and emotionally influence you to the point of control by coercion and subjugation. I wanted to make the script's synthetic nature very clear using that analogy, it's dynamically artificial. Do not accidentally become disillusioned by this scripts values, make trading decisions from it, and lastly don't become victim to predatory media magic ministry parrots with pretty, handsome smiles, compelling you to board their ferris wheel of fear. Now, on to the good stuff...
BACKSTORY:
Occasionally I find myself in situations where I have to build analyzers in Pine to actually build novel quantitative analytic indicators and tools worthy of future use. These analyzers certainly don't exist on this platform, but usually are required to engineer and tweak algorithms of the highest quality with the finest computational caliber. I have numerous other synthesizers to publish besides this one.
For many reasons, I needed a synthetic environment to utilize the analyzers I built in Pine, to even pursue building some exotic indicators and algorithms. Pine doesn't allow sourcing of tuples. Not to mention, I required numerous Pine advancements to make long held dreams into tangible realities. Many Pine upgrades have arrived and MANY, MANY more are in need of implementation for all. Now that I have this, intending to use it in the future often when in need, you can now use it too. I do anticipate some skilled Pine poets will employ this intended handy utility to design and/or improved indicators for trading.
ORIGIN:
This was inspired by the brilliance from the world renowned ALGOmist John F. Ehlers, but it's taken on a completely alien form from its original DNA. Browsing on the internet for something else, I came across an article with a small code snippet, and I remembered an old wish of mine. I have long known that by flipping back and forth on specific tickers and timeframes in my Watchlist is not the most efficient way to evaluate indicators in multiple theatres of price action. I realized, I always wanted to possess and use this sort of tool, so... I put it into Pine form, but now have decided to inject it with Pine Script steroids. The outcome is highly mutable candle formations in a reusable mutagenic package, observable above and masquerading as genuine looking price candles.
OVERVIEW:
I guess you could call it a price action synthesizer, but I entitled it "Synthetic Price Action Generator" for those who may be searching for such a thing. You may find this more useful on the All or 5Y charts initially to witness indication from beginning (barstate.isfirst === barindex==0) to end (last_bar_index), but you may also use keyboard shortcuts + + to view the earliest plottable bars on any timeframe. I often use that keyboard shortcut to qualify an indicator through the entirety of it's runtime.
A lot can go wrong unexpectedly with indicator initialization, and you will never know it if you don't inspect it. Many recursively endowed Infinite Impulse Response (IIR) Filters can initialize with unintended results that minutely ring in slightly erroneous fashion for the entire runtime, beginning to end, causing deviations from "what should of been..." values with false signals. Looking closely at spg(), you will recognize that 3 EMAs are employed to manage and maintain randomness of CLOSE, HIGH, and LOW. In fact, any indicator's barindex==0 initialization can be inspected with the keyboard shortcuts above. If you see anything obviously strange in an authors indicator, please contact the developer if possible and respectfully notify them.
PURPOSE:
The primary intended application of this script, is to offer developers from advanced to even novice skill levels assistance with building next generation indicators. Mostly, it's purpose is for testing and troubleshooting indicators AND evaluating how they perform in a "manageable" randomized environment. Some times indicators flake out on rare but problematic price fluctuations, and this may help you with finding your issues/errata sooner than later. While the candles upon initial loading look pristine, by tweaking it to the minval/maxval parameters limits OR beyond with a few code modifications, you can generate unusual volatility, for instance... huge wicks. Limits of minval= and maxval= of are by default set to a comfort zone of operation. Massive wicks or candle bodies will undoubtedly affect your indication and often render them useless on tickers that exhibit that behavior, like WGMCF intraday currently.
Copy/paste boundaries are provided for relevant insertion into another script. Paste placement should happen at the very top of a script. Note that by overwriting the close, open, high, etc... values, your compiler will give you generous warnings of "variable shadowing" in abundance, but this is an expected part of applying it to your novel script, no worries. plotcandle() can be copied over too and enabled/disabled in Settings->Style. Always remember to fully remove this scripts' code and those assignments properly before actual trading use of your script occurs, AND specifically when publishing. The entirety of this provided code should never, never exist in a published indicator.
OTHER INTENTIONS:
Even though these are 100% synthetic generated price points, you will notice ALL of the fractal pseudo-patterns that commonly exist in the markets, are naturally occurring with this generator too. You can also swiftly immerse yourself in pattern recognition exercises with increased efficiency in real time by clicking any SPAG Setting in focus and then using the up/down arrow keys. I hope I explained potential uses adequately...
On a personal note, the existence of fractal symmetry often makes me wonder, do we truly live in a totality chaotic universe or is it ordered mathematically for some outcomes to a certain extent. I think both. My observations, it's a pre-deterministic reality completely influenced by infinitesimal amounts of sentient free will with unimaginable existing and emerging quantities. Some how an unknown mysterious mechanism governing the totality of universal physics and mathematics counts this 100.0% flawlessly and perpetually. Anyways, you can't change the past that long existed before your birth or even yesterday, but you can choose to dream, create, and forge the future into your desires and hopes. As always, shite always happens when your not looking for it. What you choose to do after stepping in it unintentionally... is totally up to you. :) Maybe this tool and tips provided will aid you in not stepping in an algo cachucha up to your ankles somehow.
SCRIPTING LESSONS PORTRAYED IN THIS SCRIPT:
Pine etiquette and code cleanliness
Overwrite capabilities of built-in Pine variables for testing indicators
Various techniques to organize Settings panel while providing ease of adjustment utility
Use of tooltip= to provide users adequate valuable information. Most people want to trade with indicators, not blindly make adjustments to them without any knowledge of their intended operation/effects
When available time provides itself, I will consider your inquiries, thoughts, and concepts presented below in the comments section, should you have any questions or comments regarding this indicator. When my indicators achieve more prevalent use by TV members , I may implement more ideas when they present themselves as worthy additions. Have a profitable future everyone!

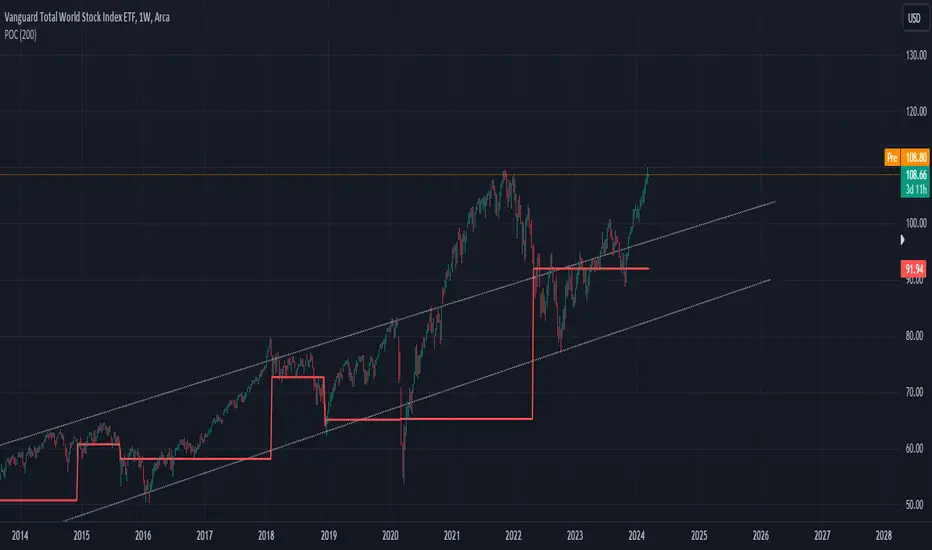
High Timeframe POCBecause the big Bitcoin crash I have been looking a lot at high timeframe metrics. I never spent much time learning POC so I decided to create a little script for determining these on higher timeframes.
Currently included: Monthly, 3 months and 6 months.
/* DEFINITION */
Point Of Control (= POC) is a price level at which the heaviest volumes were traded.
Value Area High/Low (=VAH/VAL) is a range of prices where the majority of trading volume took place. Naturally, Value Area High being the top price level and Value Area Low being the lowest. POC always is between the two.
/* HOW TO TRADE WITH THIS INDICATOR */
The basis for POC is determining bias on whichever timeframe you choose.
1. Identify a POC on the timeframe of your choosing.
/* If you choose a "low" timeframe (monthly here) then make sure to look at the higher timeframes to see how it is playing against a higher timeframe POC.
2. When the price is moving away from the POC (either to the upside or downside) this will confirm or invalidate the trade.
3. You can now enter the trade on bias or wait for a retest of the same POC.
/* EXAMPLE TRADES /*
Here is a screenshot of some of the trades that are possible solely using the POC and some common sense.
s3.tradingview.com

Baseline-C [ID: AC-P]The "AC-P" version of jiehonglim's NNFX Baseline script is my personal customized version of the NNFX Baseline concept as part of the NNFX Algorithm stack/structure for 1D Trend Trading for Forex. Everget's JMA implementation is used for the baseline smoothing method, with optional ATR bands at 1.0x and 1.5x from the baseline.
NNFX = No Nonsense Forex
Baseline = Component of the NNFX Algorithm that consists of a single moving average
Baseline ---> Meant to be used in conjunction with ATR/C1/C2/Vol Indicator/Exit Indicator as per NNFX Algorithm setup/structure. C1 is 1st Confirmation Indicator, C2 is 2nd Confirmation Indicator.
JMA (Jurik Moving Average) is used for the baseline and slow baseline.
A slow baseline option is included, but disabled by default.
The faint orange/purple lines are 1.0x/1.5x ATR from the Baseline, and are what I use as potential TP/SL targets or to evaluate when to stay out of a trade (chop/missed entry/exit/other/ATR breach), depending on the trade setup (in conjunction with C1/C2/Vol Indicator/Exit Indicator)
This script is heavily based upon jiehonglim's NNFX Baseline script for signaling, barcoloring, and ATR.
SSL Channel option included but disabled by default (Erwinbeckers SSL component)
POC (Point of Control) from Volume Profile is included/enabled by default for both the current timeframe and 12HR timeframe
03.freeman's InfoPanel Divergence Indicator was used a reference to replace the current/previous ATR information infopanel/info draw from jiehonglim's script. I'm not sure whether I like the previous way ATR info was displayed vs how I have it currently, but it's something that is completely optional:
Specifically: I am tuning this baseline/indicator for 1D trading as part of the NNFX system, for Forex.
DO NOT USE THIS INDICATOR WITHOUT PROPER TUNING/ADJUSTMENT for your timeframe and asset class.
Note about lack of alerts:
Alerts for baseline crosses (and other crosses) have been purposefully omitted for this version upon initial publication. While getting alerts for baseline crosses under certain conditions/filtered conditions that eliminate low-importance signals and crossover whipsaw would be great, it's something I'm still looking into.
SPECIFICALLY: There are entry, exit, take profit, and continuation signal components in relation to the Baseline to the rest of the NNFX Algorithm stack (ATR/C1/C2/Vol Indicator/Exit Indicator), including but limited to the "1 candle rule" and the "7 candle rule" as per NNFX.
Implementing alerts that are significant that also factor in these rules while reducing alert spam/false signals would be ideal, but it's also the HTF/Daily chart - visually, entry/exit/continuation signal alignment is easy to spot when trading 1D - alerts may be redundant/a pursuit in diminishing returns (for now).
//-------------------------------------------------------------------
// Acknowledgements/Reference:
// jiehonglim, NNFX Baseline Script - Moving Averages
//
// Fractured, Many Moving Averages
//
// everget, Jurik Moving Average/JMA
//
// 03.freeman, InfoPanel Divergence Indicator
//
// Ggqmna Volume stops
//
// Libertus RSI Divs
//
// ChrisMoody, CM_Price-Action-Bars-Price Patterns That Work
//
// Erwinbeckers SSL Channel
//

Institutional Top-Bottom by Herman Sangivera (Papua)Institutional Top-Bottom + Volume Profile by Herman Sangivera ( Papua )
📈 Component Description
Orange Line (POC - Point of Control): This represents the "Fair Value." Institutions view prices far above this line as "Expensive" (Premium) and prices below as "Cheap" (Discount).
Green/Red Boxes (Order Blocks): These are footprints left by big banks. A Green Box is a demand zone where institutional buying occurred, and a Red Box is a supply zone where institutional selling happened.
Institutional Labels: These appear when the RSI Divergence confirms that price momentum is fading, signaling a high-probability reversal (Top or Bottom).
🚀 Trading Strategy Guide
1. The High-Probability Buy Setup (Bottom)
Look for a "Confluence" of these three factors:
Location: Price is trading below the Orange POC line (Discount zone).
The Zone: Price enters or touches a Green Order Block.
The Signal: The "INSTITUTIONAL BUY" label appears.
Entry: Enter Buy at the close of the candle with the label.
Stop Loss: Place it just below the Green Order Block.
Take Profit: Target the Orange POC line or the nearest Red Order Block.
2. The High-Probability Sell Setup (Top)
Look for a "Confluence" of these three factors:
Location: Price is trading above the Orange POC line (Premium zone).
The Zone: Price enters or touches a Red Order Block.
The Signal: The "INSTITUTIONAL SELL" label appears.
Entry: Enter Sell at the close of the candle with the label.
Stop Loss: Place it just above the Red Order Block.
Take Profit: Target the Orange POC line or the nearest Green Order Block.
💡 Pro Tips for Accuracy
Timeframes: For the best results, use 15m for Scalping, and 1H or 4H for Day/Swing Trading.
Wait for the Candle Close: Labels are based on Pivot points. Always wait for the current candle to close to ensure the signal is locked and won't "repaint."
Avoid Flat Markets: This indicator works best when there is volatility. Avoid using it during "choppy" or sideways markets with very low volume.

Volume ProfileVolume Profile — Daily & Weekly Levels
This indicator plots session-based Volume Profile levels directly on the chart, focusing on Daily and Weekly structures.
It is designed to help visualize areas where trading activity was most concentrated during the current and previous periods.
The script calculates and displays the following levels:
POC (Point of Control) — price level with the highest traded volume
VAH (Value Area High) — upper boundary of the value area
VAL (Value Area Low) — lower boundary of the value area
Features
Today’s Volume Profile
POC, VAH, and VAL updated in real time during the current trading day
Yesterday’s Volume Profile
Previous day’s POC, VAH, and VAL extended forward as reference levels
Current Weekly Volume Profile
Live weekly POC, VAH, and VAL
Previous Weekly Volume Profile
Last week’s completed POC, VAH, and VAL
Configurable Inputs
Adjustable number of volume bins (rows)
Custom value area percentage
Toggle visibility for daily, yesterday, weekly, and previous weekly levels
Optional labels with configurable horizontal offset
How it works
The indicator builds a custom volume distribution by aggregating volume across price bins within each session (daily or weekly).
From this distribution, it identifies:
The price level with maximum volume (POC)
The value area surrounding the POC based on the selected percentage
All calculations are performed locally using historical bar data, without external data sources.
Alerts
An alert condition is included that triggers when price crosses any visible Volume Profile level (POC, VAH, or VAL).
Notes
This indicator is designed for market structure and volume analysis.

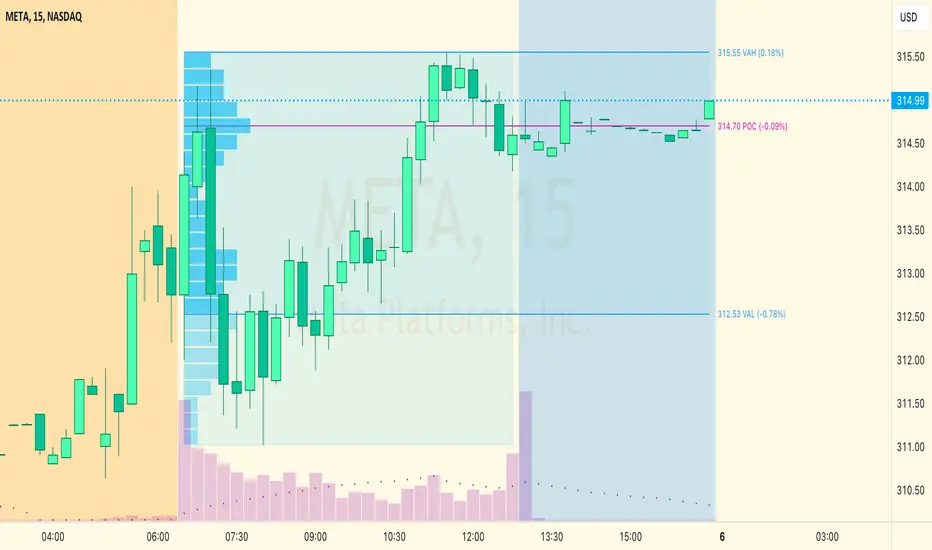
Value Area PRO (TPO/Volume Session VAH/VAL/POC) 📌 AP Capital Value Area PRO (TPO / Volume)
AP Capital Value Area PRO is a session-based value area indicator designed for Gold (XAUUSD), NASDAQ (NAS100), and other CFD instruments.
It focuses on where the market has accepted price during the current session and highlights high-probability interaction zones used by professional traders.
Unlike rolling lookback volume profiles, this indicator builds a true session value area and provides actionable signals around VAH, VAL, and POC.
🔹 Core Features
Session-Anchored Value Area
Value Area is built only during the selected session
Resets cleanly at session start
Levels develop during the session and can be extended forward
No repainting or shifting due to lookback changes
TPO or Volume Mode
TPO (Time-at-Price) mode – ideal for CFDs and tick-volume data
Volume mode – uses broker volume if preferred
Same logic, different weighting method
Fixed Price Bin Size
Uses a fixed bin size (e.g. 0.10 for Gold, 0.25–0.50 for NAS100)
Produces cleaner, more realistic VAH/VAL levels
Avoids distorted profiles caused by dynamic bin scaling
VAH / VAL / POC Levels
VAH (Value Area High)
VAL (Value Area Low)
POC (Point of Control) (optional)
Lines can be extended to act as forward reference levels
🔹 Trading Signals & Alerts
Value Re-Entry
Identifies false breakouts where price:
Trades outside value
Then closes back inside
Often seen before strong mean-reversion or continuation moves.
Acceptance
Detects initiative activity using:
Multiple consecutive closes outside value
Filters out weak single-candle breaks
Rejection
Flags strong rejection candles:
Large candle body
Wick outside value
Close back inside the value area
These conditions are especially effective on Gold intraday.
🔹 Optional Profile Histogram
Right-side volume/TPO histogram
Buy/sell imbalance visualization
Fully optional to reduce chart clutter and improve performance
🔹 Best Use Cases
Recommended markets
XAUUSD (Gold)
NAS100 / US100
Other index or metal CFDs
Recommended timeframes
5m, 15m, 30m
Suggested settings
Mode: TPO
Value Area: 70%
Bin size:
Gold: 0.10
NAS100: 0.25 or 0.50
🔹 How Traders Use It
Trade rejections at VAH / VAL
Look for acceptance to confirm trend days
Use re-entries to fade failed breakouts
Combine with trend filters, EMA structure, or session context
⚠️ Disclaimer
This indicator is provided for educational and analytical purposes only and does not constitute financial advice. Always manage risk appropriately.

EduVest - IFA-VP Context v3.0 [NEON Edition]📊 IFA-VP Context v3.0
A powerful market context indicator combining Volume Profile analysis with SMA trend detection. Designed with a cyberpunk-inspired NEON color palette for maximum visibility on dark charts.
━━━━━━━━━━━━━━━━━━━━━━━━━━━━━━
🎯 WHAT IT DOES
This indicator helps you understand "where you are" in the market by analyzing:
• Volume Profile (POC, VAH, VAL)
• SMA Alignment (20/50/200)
• Context Score (0-100)
━━━━━━━━━━━━━━━━━━━━━━━━━━━━━━
⚡ KEY FEATURES
🔹 NEON Color Palette - Cyan/Pink/Gold colors optimized for dark mode
🔹 Context Score - Visual score bar (████████░░) shows market strength
🔹 Cross Signals - GOLDEN CROSS / DEATH CROSS with HUGE labels
🔹 POC Reaction - Track price interaction with Point of Control
🔹 Status Panel - All-in-one dashboard with trend, zone, and hints
━━━━━━━━━━━━━━━━━━━━━━━━━━━━━━
📺 THREE DISPLAY MODES
• Impact Mode - Full visual experience with badges, ribbons, and glow effects
• Minimal Mode - Clean SMA lines and VP levels only
• Pro Mode - Complete VP histogram display
━━━━━━━━━━━━━━━━━━━━━━━━━━━━━━
📈 SIGNALS EXPLAINED
▲ GOLDEN CROSS (20×50) - Short-term bullish momentum
▼ DEATH CROSS (20×50) - Short-term bearish momentum
⭐ MAJOR GOLDEN (50×200) - Long-term bull market signal
💥 MAJOR DEATH (50×200) - Long-term bear market signal
Context Badges:
⚡ SUPER BUY/SELL (Score 80+)
🔥 POWER BUY/SELL (Score 70-79)
💪 STRONG BUY/SELL (Score 60-69)
⏸ WAIT (Score <50)
━━━━━━━━━━━━━━━━━━━━━━━━━━━━━━
⏰ RECOMMENDED TIMEFRAMES
✅ 15min - 4H (Best for day trading & swing)
⚠️ 1min-5min (Noisy, use with caution)
━━━━━━━━━━━━━━━━━━━━━━━━━━━━━━
⚠️ DISCLAIMER
This is NOT a buy/sell signal indicator.
It shows market CONTEXT to help your own trading decisions.
Always use proper risk management and combine with your own analysis.
━━━━━━━━━━━━━━━━━━━━━━━━━━━━━━
🏷️ Tags: volume profile, sma, context, trend, neon, dark mode, poc, value area

Auction Context Engine ( Value Area, VWAP & Regime)📌 Indicator Name
Auction Context Engine (Value Area, VWAP & Regime)
Short name: ACE Context
🧠 Description
Auction Context Engine (ACE) is a professional market context and structure indicator based on Auction Market Theory.It is designed to help traders understand where the market is positioned, not to generate trade signals.
ACE focuses on:
• Developing Value Area (VAH / VAL)
• Developing Point of Control (POC)
• Session VWAP positioning
• Volatility regime expansion
• Opening Range context
• Failed auction / trap detection
• Market bias and environment quality
This indicator provides context only and is intended to be used alongside a separate execution strategy or system.
🎯 What This Indicator Is
✔ A context engine
✔ A market structure filter
✔ A bias alignment tool
✔ A regime and environment classifier
❌ What This Indicator Is NOT
✘ Not a signal generator
✘ Not a buy/sell system
✘ Not a strategy
✘ Not a profitability promise
📊 How To Use
Use ACE to answer:
• Is price accepting or rejecting value?
• Is the market in balance or expansion?
• Is VWAP supporting or opposing price?
• Is this a breakout environment or a trap?
• Is volatility expanding?
• Is the market trending or ranging?
You may then use your own execution strategy aligned with this context.
🟢 Core Components
Developing Value Area
• VAH / VAL dynamically update through the session
• POC tracks highest traded volume area
VWAP Position
• Above VWAP = bullish bias
• Below VWAP = bearish bias
Opening Range Context
• Detects breakouts or balance after session open
Volatility Regime
• Identifies expansion vs normal conditions
Failed Auction Detection
• Highlights trap conditions near value extremes
Market Quality
• Strong / Mixed / Weak environment classification
Context Table
• Clean 1-column vertical dashboard with color-coded bias
🔵 Visual Elements
• Developing VAH, VAL, POC lines
• Session VWAP
• Small context dots when environment turns READY
• Compact professional context table
⚙️ Settings
• Value Area bin size
• Value area percentage
• Opening range duration
• Regime expansion factor
• Line colors and thickness
• Context table ON/OFF
• Context dots ON/OFF
🧩 Best Use Case
This indicator is ideal for:
• Intraday trading
• Index futures and equities
• Options context filtering
• Trend / range regime identification
• Professional discretionary traders
⚠️ Disclaimer
This script is provided for educational and informational purposes only.It does not constitute financial or investment advice.Trading involves risk. Always use proper risk management.

[Greeny] RTH Only Naked VPOCWhat it does
Calculates and displays daily Volume Point of Control (VPOC) levels based on RTH (Regular Trading Hours) session only. Tracks which VPOCs remain "naked" (untouched) and which have been hit - but only counts hits during RTH hours, ignoring overnight/globex touches.
Key Features
One VPOC per trading day calculated from entire RTH session volume profile
RTH-only hit detection - levels only marked as hit when touched during RTH, not overnight
Works on all timeframes - daily, hourly, or any chart timeframe
Volume-based filtering - automatically skips low-liquidity sessions (pre-front-month contract data)
Visual markers - small dash on origin bar shows where each VPOC was, even after being hit
Visual Guide
Yellow dashed line - Naked VPOC (not yet touched during RTH)
White dashed line - Hit VPOC (was touched during RTH)
Small dash on candle - POC origin marker
Settings
Display options: Toggle to show only naked POCs, customize hit/naked colors, adjust line width and style (solid/dashed/dotted), enable/disable line extension and origin markers.
RTH Session: Configure start and end time in NY timezone. Default is 9:30-16:00 (US equity market hours), which equals 15:30-22:00 Budapest time.
Advanced: Adjust volume profile resolution (default 250 bins), data source timeframe for calculations (5min recommended for daily charts), and minimum volume threshold to filter out low-liquidity sessions like pre-rollover contract data (default 10% of average).
Best For
ES/MES, NQ/MNQ futures traders
Mean reversion strategies using VPOC as support/resistance
Auction Market Theory practitioners
Anyone wanting clean RTH-only volume profile levels
Note on Contract Rollovers
When using specific contract symbols (e.g., ESH2026 instead of ES1!), the script may show many naked VPOCs from months before the contract became active. This happens because futures contracts have very low liquidity before becoming the front-month, creating unreliable VPOCs with gaps that never get hit. The volume filter helps reduce this, but you may need to increase the "Min Volume % of Average" setting or simply ignore older levels when viewing back-month data.

Dynamic Supports + Volume Profile (Smart Time Selector)This indicator is an "All-in-One" tool designed to simplify Market Structure and Volume analysis on higher timeframes (especially Daily charts).
Its main innovation is the **Unique Period Selector**, which automatically adjusts 5 internal parameters (tolerance, pivot sensitivity, resolution, and historical depth) with a single click.
**🛠️ MAIN FEATURES:**
1. **Automatic Engine (1-5 Years):**
* Forget about manually setting pivot lengths or "Lookback".
* Select **"1 Year"**: The script scans for fast pivots and recent volume for *Swing Trading*.
* Select **"5 Years"**: The script filters noise and shows only "Rock-Solid" structures (Historical S/R) for *Long Term Investing*.
2. **"Merged" Support & Resistance (S/R):**
* The script detects Pivot Highs/Lows.
* **Fusion Logic:** If price bounces multiple times in the same zone (within calculated tolerance), the script updates the existing line instead of drawing a new one. It extends the line and counts the touches (e.g., "S (4)" means a Support validated 4 times).
* **Clean Chart:** Avoids visual noise.
3. **Lateral Volume Profile (VP):**
* Displays volume distribution to the right of the current price.
* **Orange POC (Point of Control):** Marks the exact price level with the highest trading volume in the selected period.
**🚀 HOW TO USE (STRATEGY):**
Best used on the **Daily Timeframe (1D)**:
* **Scenario 1: Mean Reversion**
* If price moves far from the **Orange POC**, look for it to act as a magnet.
* Enter when price touches a **Green Line (Support)** that aligns with a high volume node.
* **Scenario 2: Breakout**
* If price breaks a **Red Line (Resistance)** aggressively and the volume above is thin (low volume nodes), the move tends to be fast due to lack of friction.
* **Scenario 3: Multi-Timeframe Analysis**
* Use "5 Years" to mark your long-term zones.
* Switch to "1 Year" for tactical entries.
**🎨 VISUAL SETTINGS:**
* **Green Lines:** Demand Zones (Supports).
* **Red Lines:** Supply Zones (Resistances).
* **Dotted Orange Line:** POC (Fair Value).
* **Blue Bars:** Volume Profile.
**Disclaimer / Descargo:**
This script is designed for educational and analytical purposes on the daily timeframe. Use it to identify zones of interest, not as automatic buy/sell signals.
